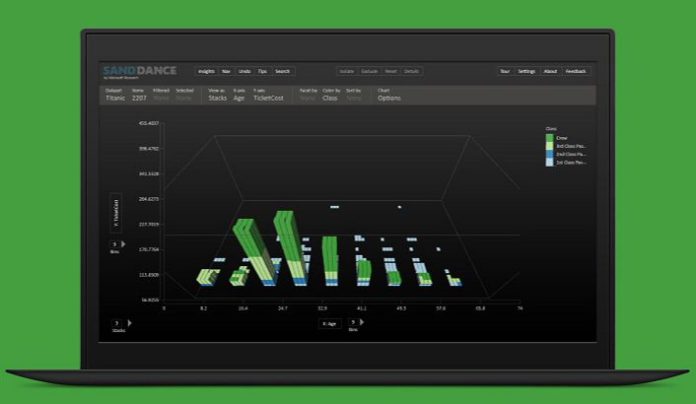
Microsoft SandDance is a free visualization tool for insight in your surveys and research projects. SandDance is the latest project to come out of Microsoft Garage. Microsoft SandDance works best with data sets have between 50 and 300,000 rows. You can try the Web-based interface to learn how the app works. There are a number of visualization options including 3D scatterplot, maps, charts and histograms.
Microsoft SandDance Features include:
<1> Runs in your browser.
<2> Handles multi-dimensional datasets of hundreds of thousands of rows and 30 columns.
<3> Uses unit visualizations, which maintain a one-to-one mapping between rows in your database and marks on the screen.
<4> Shows a large number of related views by changing how marks are organized, along with their color, size, and shape.
<5> Creates smooth transitions between views to help maintain context as you interact with your data.

